Harbour Chines · 高贵林 (Coquitlam)
Harbour Chines 社区页把最新房源、房型入口、买家判断、投资风险和本地市场线索放在同一个页面,方便先做社区级筛选。
Harbour Chines 适合谁?
适合想把预算、通勤、学校、房型、社区供应、持有成本和未来转售流动性一起比较的买家、业主和投资者。不要只看单套房源价格;社区本身往往决定议价空间和长期风险。
买家看什么?
预算、通勤、学校、房型、楼龄、周边同类供给和未来转售。
投资者看什么?
租赁需求、现金流、空置风险、保险、维修、物业费和法规变化。
业主看什么?
同区挂牌竞争、社区更新、一改多或土地潜力,以及买家偏好变化。
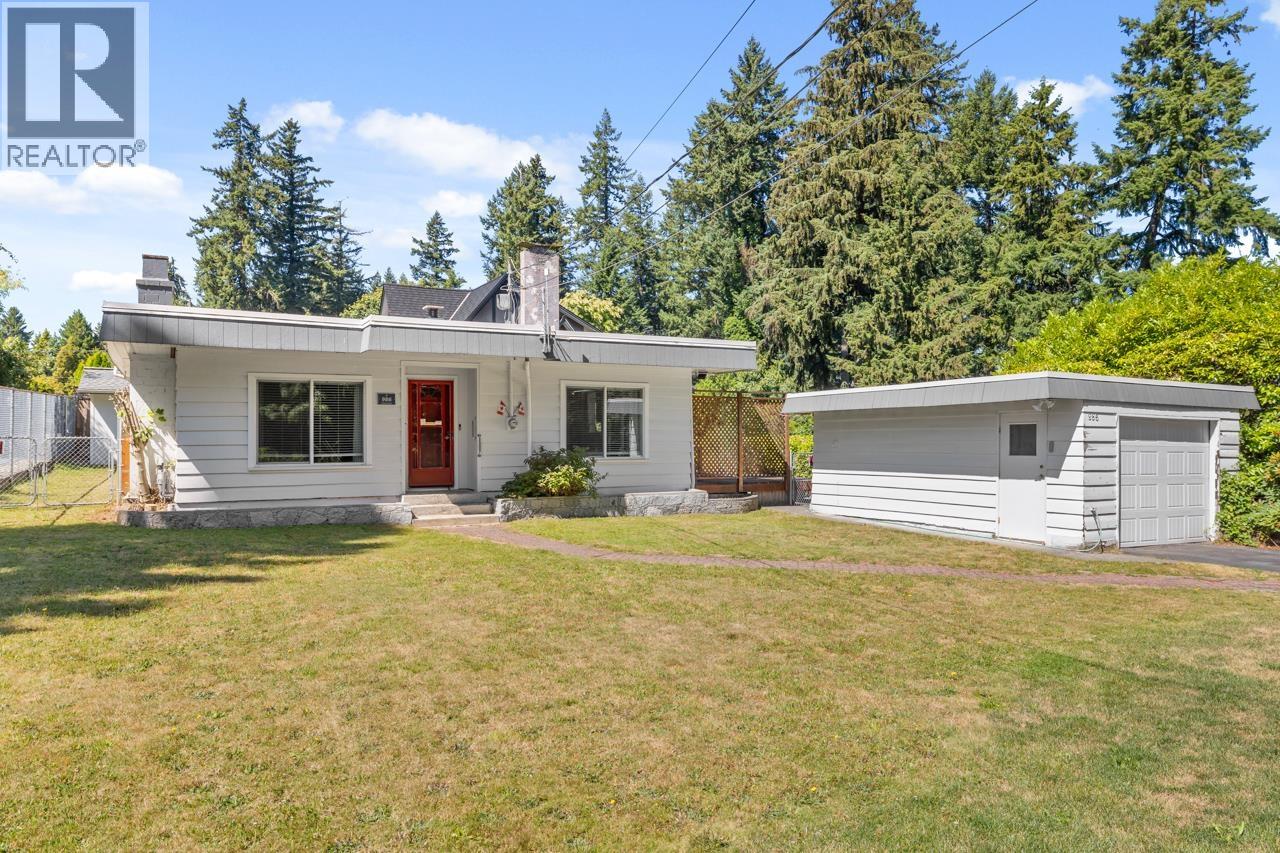
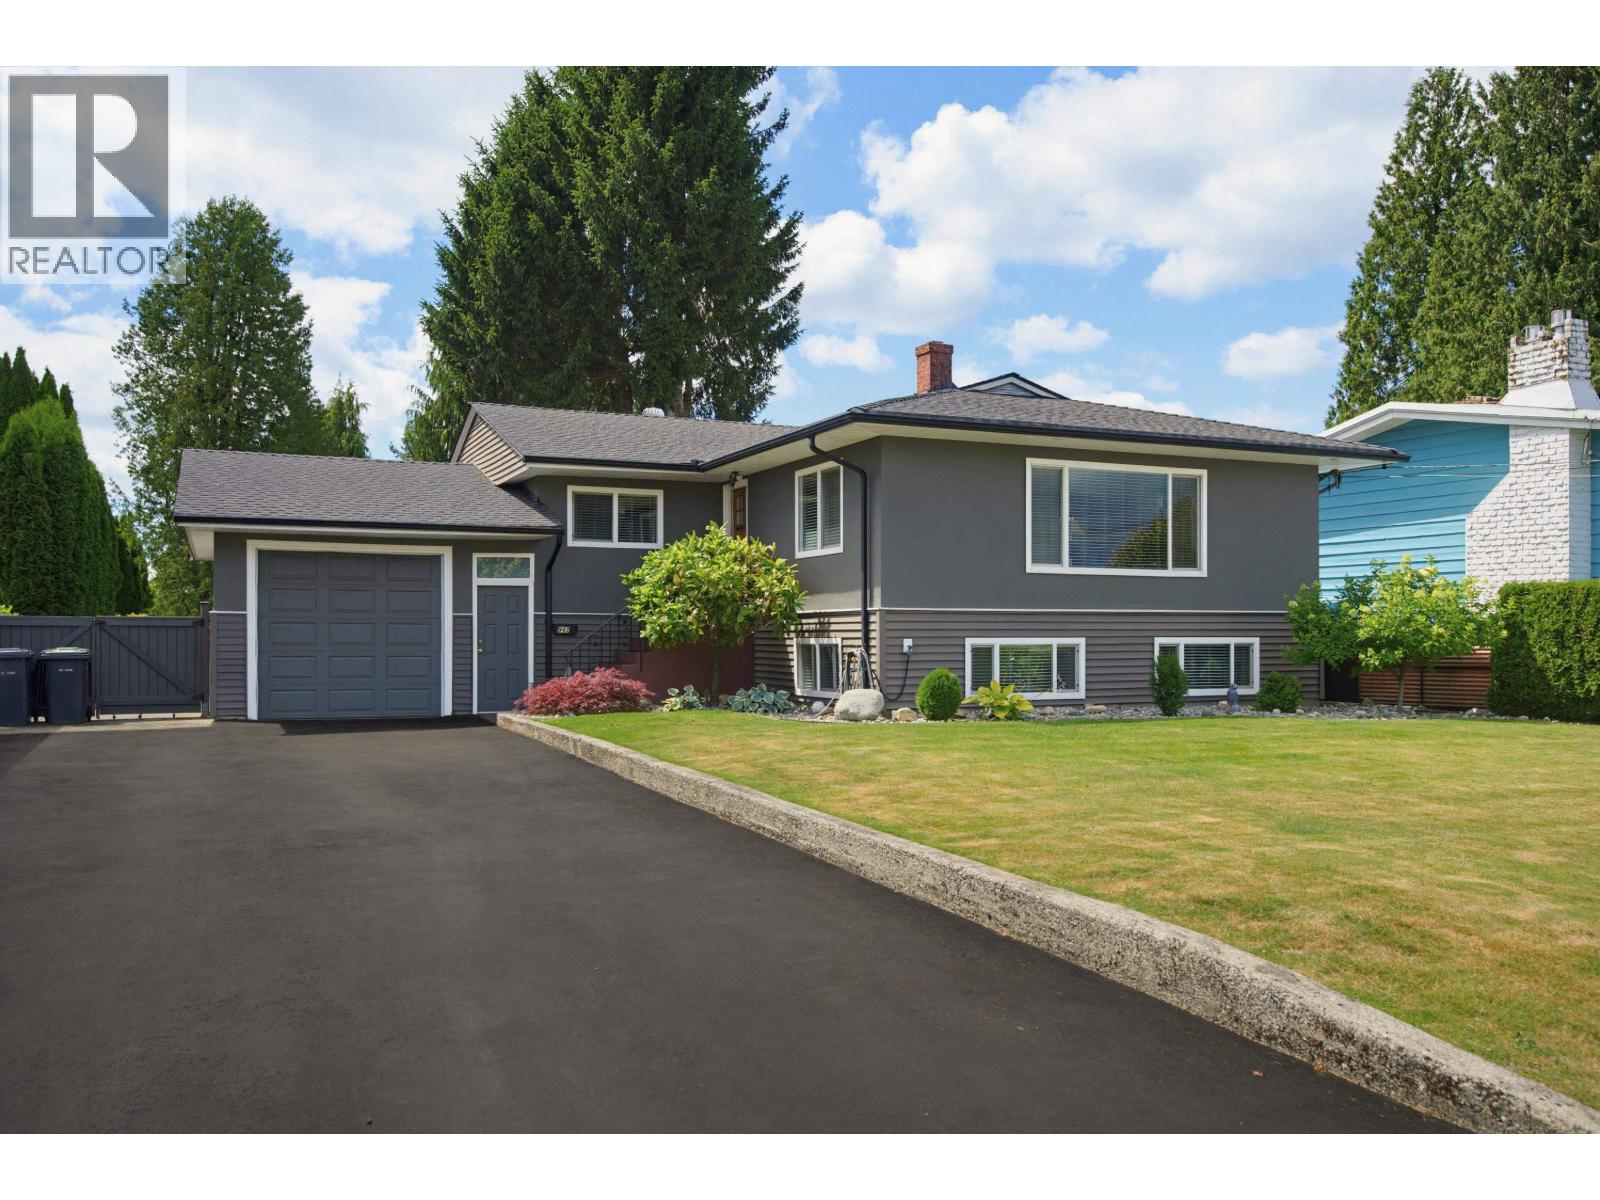
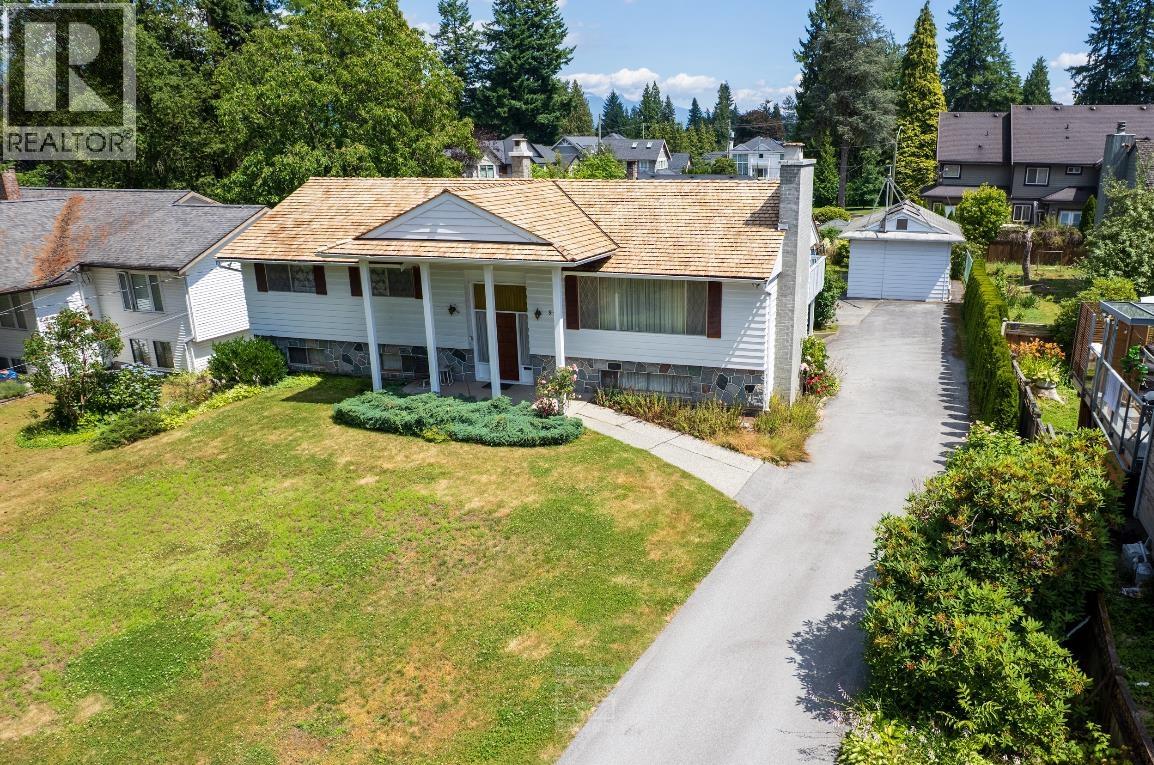
最新 Harbour Chines 房源
在售
C$1,549,000
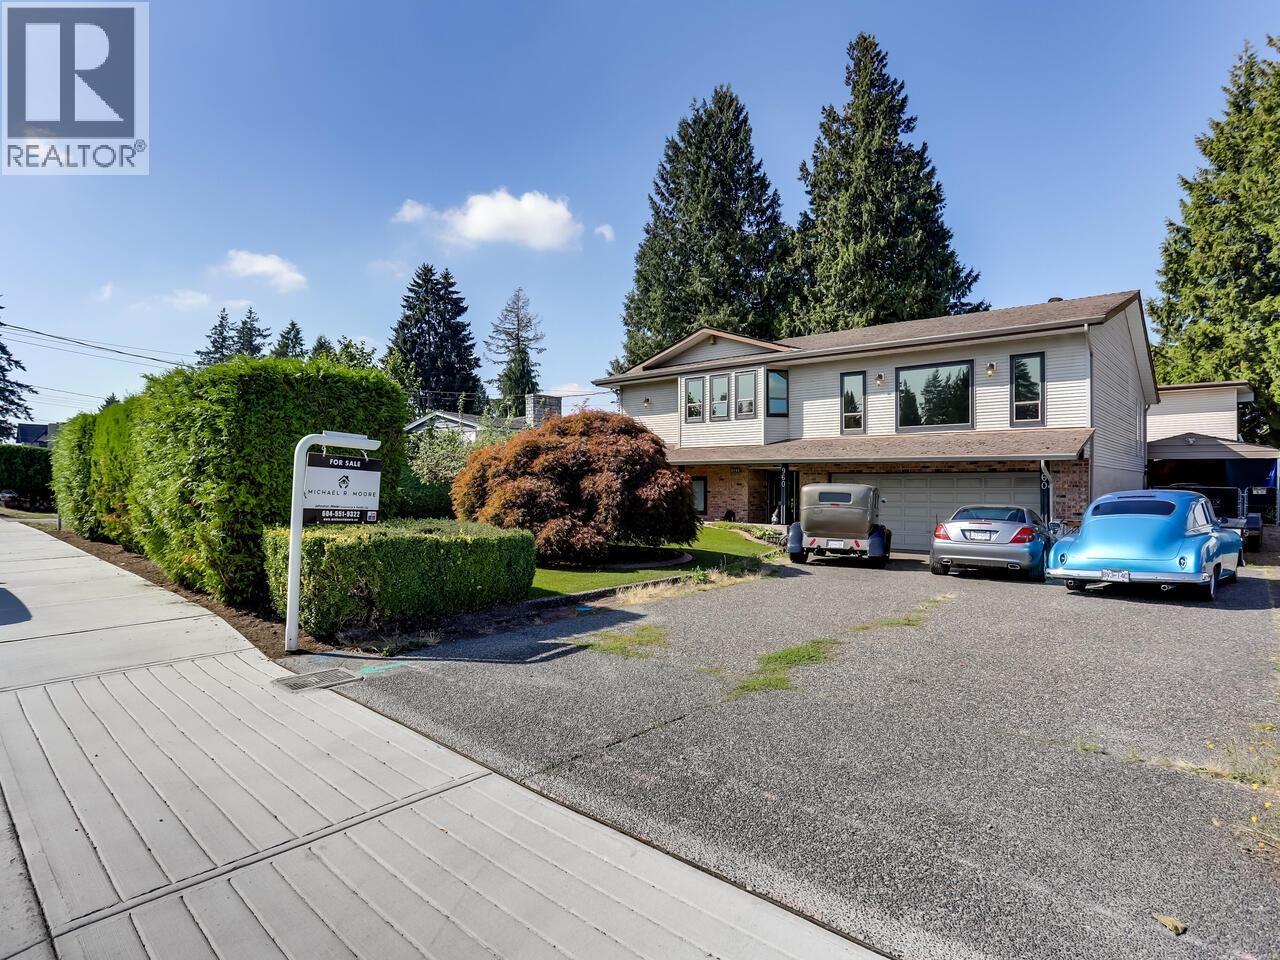
在售
C$1,888,000
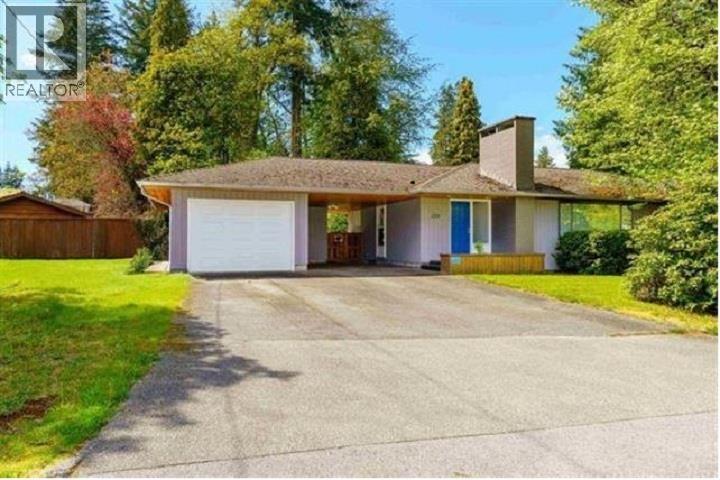
在售
360 VTour
C$1,500,000
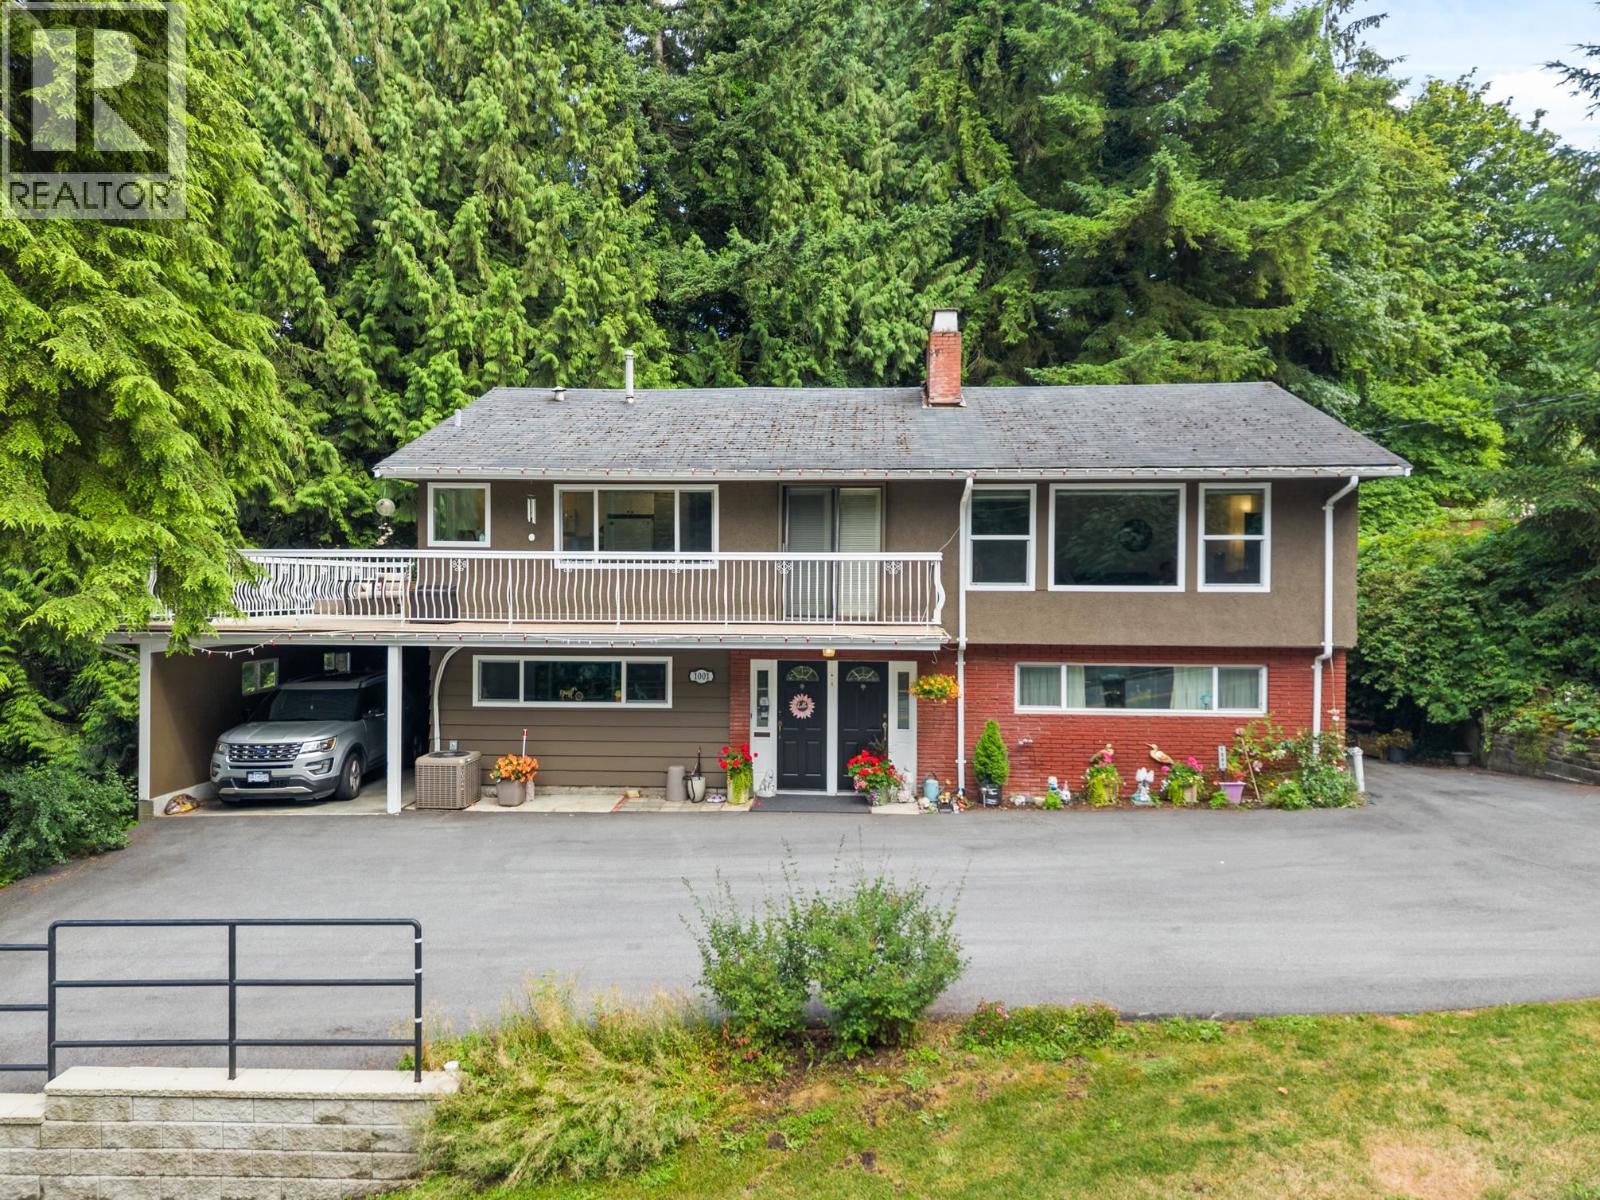
在售
360 VTour
C$1,714,785
在售
C$2,099,000

在售
360 VTour
C$1,999,900
在售
C$1,150,000